18th jan, we used dice to randomly fill up the squares
karl asked us to throw two time for each square, one for X co-ordinate, the other one is for Y co-ordinate.
we had to fill up 36 squares of 72.
and we have 6 kinds of shapes to choose.
i was thinking, since we had to use dice to fill up, why not also use it to decide what shape i fill with,
so i threw three times for each square.
here is the outcome


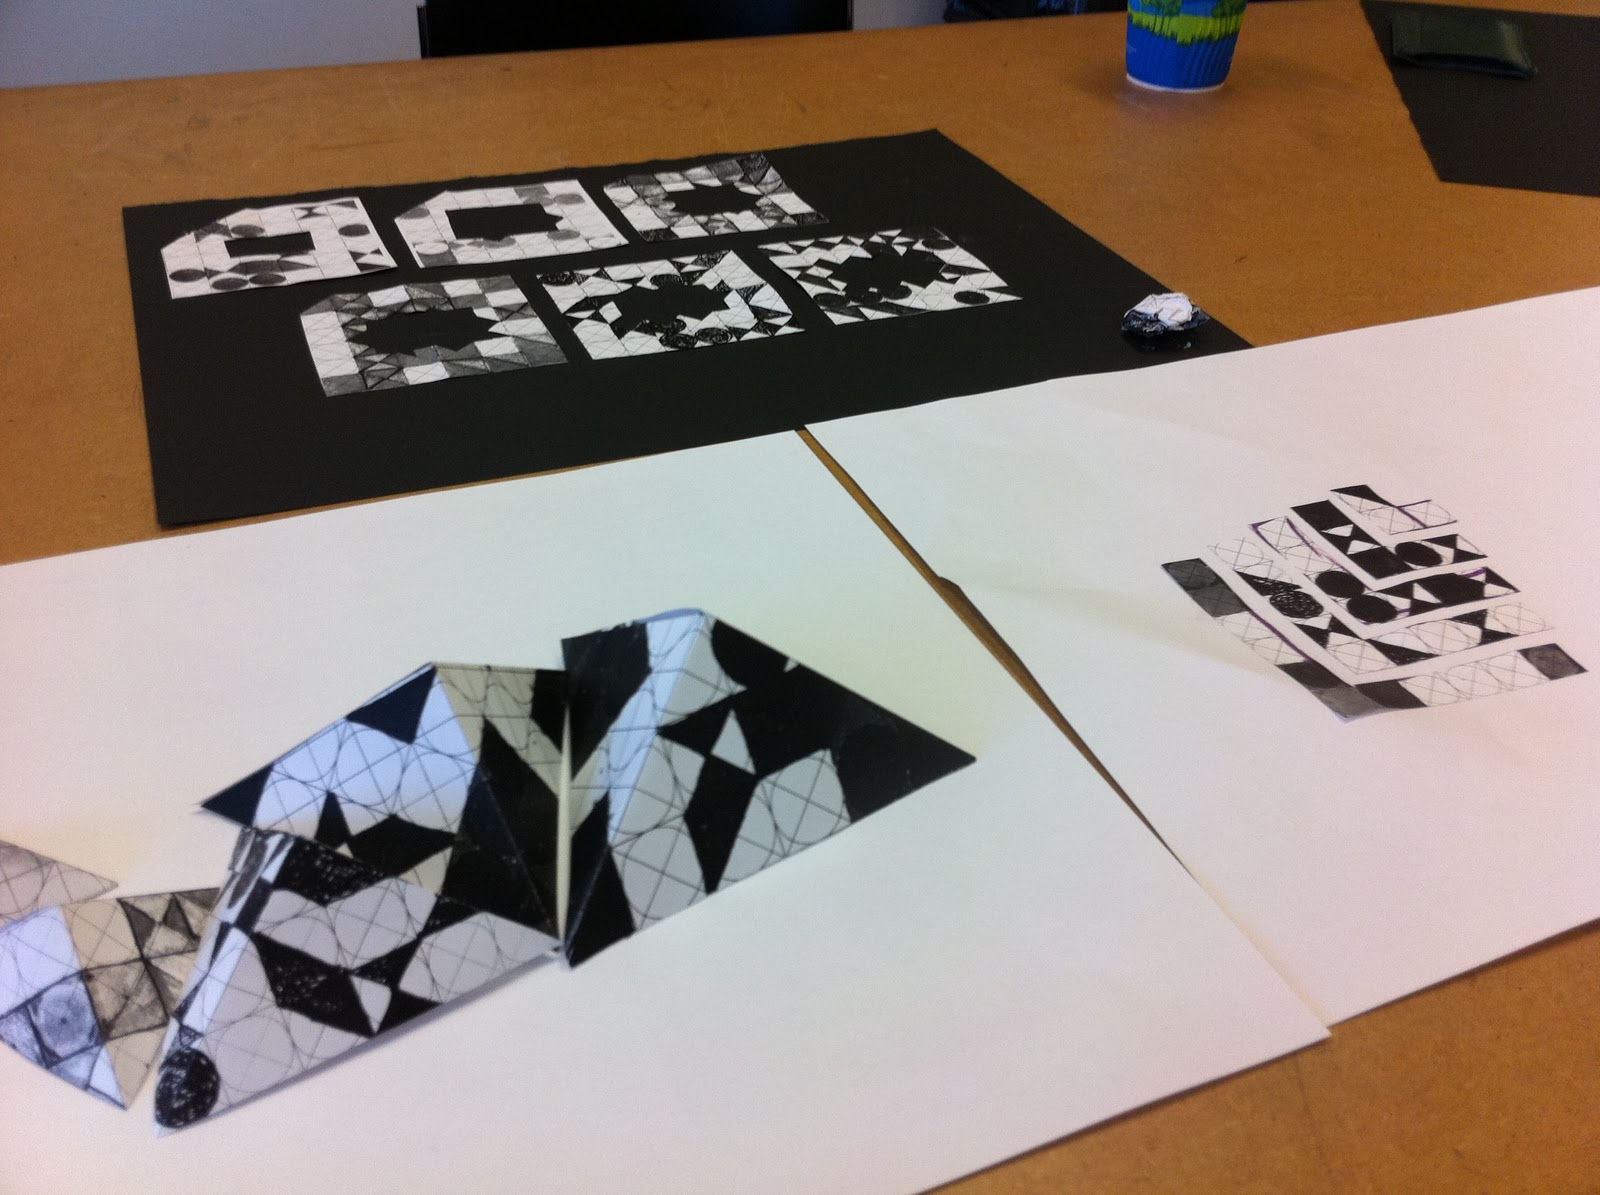
these are classmates' works
all we used are just dice, so it's cool and surprise that we could have these images,
the second experiment is to used these images to describe three different statistics.
1. human populations
2. by-election results for oldham East and Saddleworth
3. football league table
this exercise is harder than i thought, not as easy as it looks.
the first one we used number of square to define the size of the area
and used color of square to define how crowded is that area.

from the top, the area is Asia, Africa, the Americas and Caribbean, Europe, Oceania.
the second example we tried to make in 3d way.
the size and color are still symbol of group and numbers of people.

and we also linked them together to let them like a group of statistic.
the third one was killing us, maybe it was almost the time class had dismiss,
we couldn't find good idea for it.
still, we made it.

these are the images our group made.
沒有留言:
張貼留言